Janet Yellen Speaks Out on Inequality and Opportunity in America

2014-10-27 Yellen at FRB BostonLast week, the Chair of the Federal Reserve Janet Yellen spoke about inequality and opportunity in America. Her remarks were based on recent results from the Federal Reserve’s triennial Survey of Consumer Finances (SCF). The survey includes roughly 6,000 U.S. households and provides specific details about their income, wealth, and debt. This look at family balance sheets formed the basis for Chair Yellen’s remarks on inequality and economic opportunity in the U.S.

You can watch the video, read the full speech, and view the slides at the bottom of this page.

I wanted to highlight for you the four building blocks of economic opportunity that were identified by Chair Yellen in her speech, along with some supporting charts from the survey. In future posts, we’ll dive more deeply into the topic of inequality.

Four Building Blocks of Economic Opportunity in America

#1. Resources Available for Children

2014-10-24 Yellen 1 Fig 9
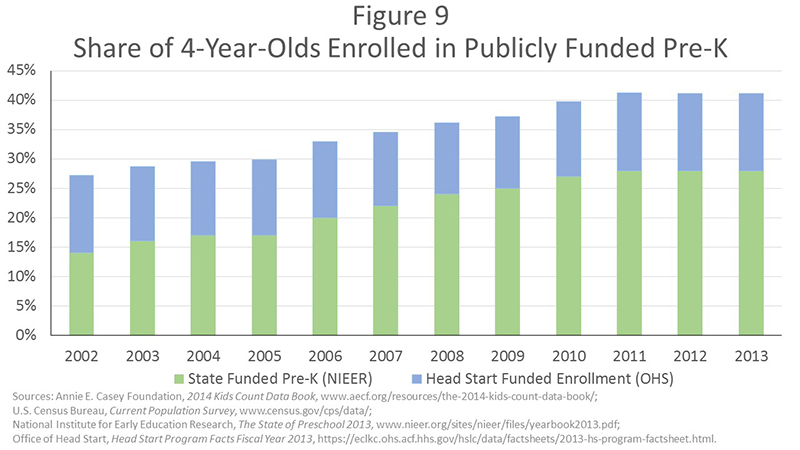
Figure 9 above shows that access to quality early childhood education has improved since the 1990s, but it remains limited–41% of children were enrolled in state or federally supported programs in 2013.

Continue reading

Educators “Meet the Experts” in San Francisco

What happens when you mix brilliant economic minds and keen educators? An enthusiastic day of discussion, questions, professional development, and yes – even some fun! We recently hosted 70 educators from throughout the 12th District at our head office in San Francisco for Meet the Experts (MTE), a speaker series designed to provide secondary and post-secondary educators with an opportunity to interact with leaders from throughout the Bank.

MTE brand bannerWith MTE, our objective is to highlight emerging issues in the economy and foster greater understanding about the roles and responsibilities of the Federal Reserve. See how we strove towards that goal with the day’s agenda.  Remember to return to this blog in the following weeks as we’ll be providing tips for discussing this year’s MTE topics with your students.

Lansing

Kevin Lansing presented on asset bubbles

The day started off with a dive right into economics content and a very timely topic: asset price bubbles. Kevin Lansing, Research Advisor for our Economic Research group, took the audience through a brief history of bubbles (notably the Tulip Mania bubble from 17th century Netherlands), then touched on three points that explain bubbles: forecasts based on past price movements, social dynamics and human emotion, and market structure. Kevin also discussed policy implications of lessons learned from price bubbles. His presentation slides are here.

Continue reading

Teaching About Income Inequality – Three Charts and Two Tips

If you’re looking for a quick start into the issue of income inequality, our new DataPost series might just do the trick. The series uses a fairly simple comparison to define income inequality and chart that comparison over time. The full series includes: U.S. Household Incomes: A Snapshot, Median Household Incomes: Life in the Middle, and Income Inequality: Measuring the Gap.

To introduce the idea of income equality to your students, consider using the following three charts.

1.     Income Distribution

The first place to start the discussion is by taking a look at the distribution of U.S. household incomes. The chart below gives the percentage of U.S. households in each income category. At the lowest end of the distribution, 3.4% of American households earned less than $5,000 in 2012. At the highest end of the distribution, 4.5% of American households earned $200,000 or more in 2012.

There are some interesting things to note about the shape of this distribution.  First, there are more households in the lower income categories than you might expect.  In a normal distribution – think the bell shaped curve – values tend to pile up in the middle.  Here, though, there are greater concentrations at the low end of the distribution.

Continue reading