
This week we wanted to take a deeper dive into the recent PISA financial literacy assessment by looking at the test framework and reviewing a snapshot of student performance across the 18 countries that participated.
What is Financial Literacy? – PISA Definition
Financial literacy is knowledge and understanding of financial concepts and risks, and the skills, motivation and confidence to apply such knowledge and understanding in order to make effective decisions across a range of financial contexts, to improve the financial well-being of individuals and society, and to enable participation in economic life. (via)
The Students and Money Framework
The financial literacy assessment consisted of a total of 40 questions organized into three broad perspectives: content, processes, and context. Under each of these perspectives, four categories of questions were then identified. These 12 categories formed the PISA “framework” for measuring financial literacy, see table below:
PISA 2012 Financial Literacy Framework (via)
 Financial Literacy – What is “Proficient”?
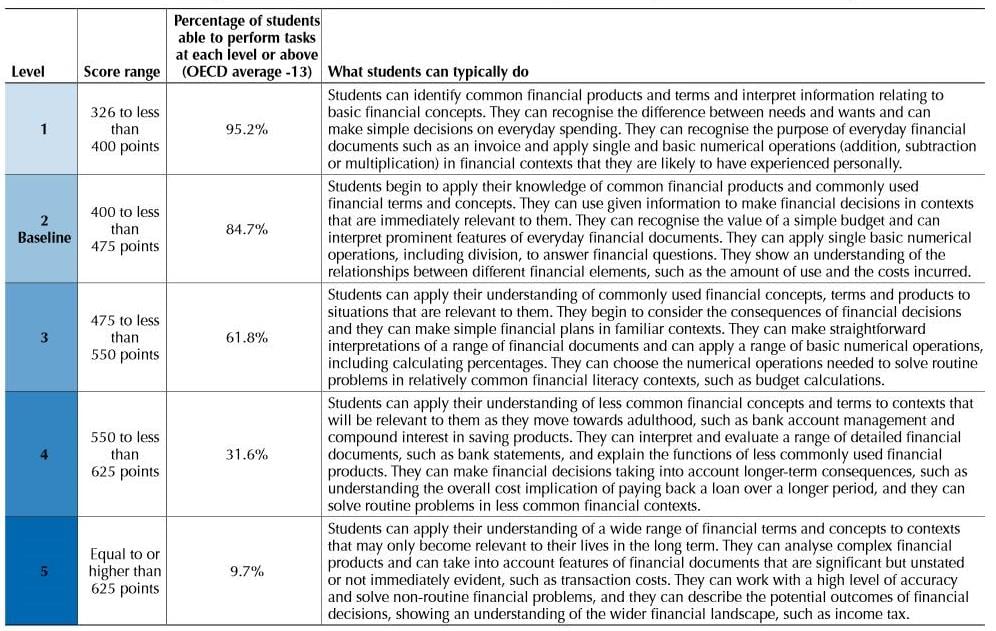
Following PISA practice for reporting achievement in the domains of mathematics, reading, and science, the financial literacy results were scaled to have a mean of 500 and a standard deviation of 100. A proficiency scale was created based on the 2012 data and divided into five levels based on total score. The table below gives a nice summary of the proficiency levels identified in the study. Level 2 is considered to be the “baseline” level of proficiency in financial literacy with minimum score of 400.
Summary description of the five levels of proficiency in financial literacy (via)
 Performance Level Snapshot
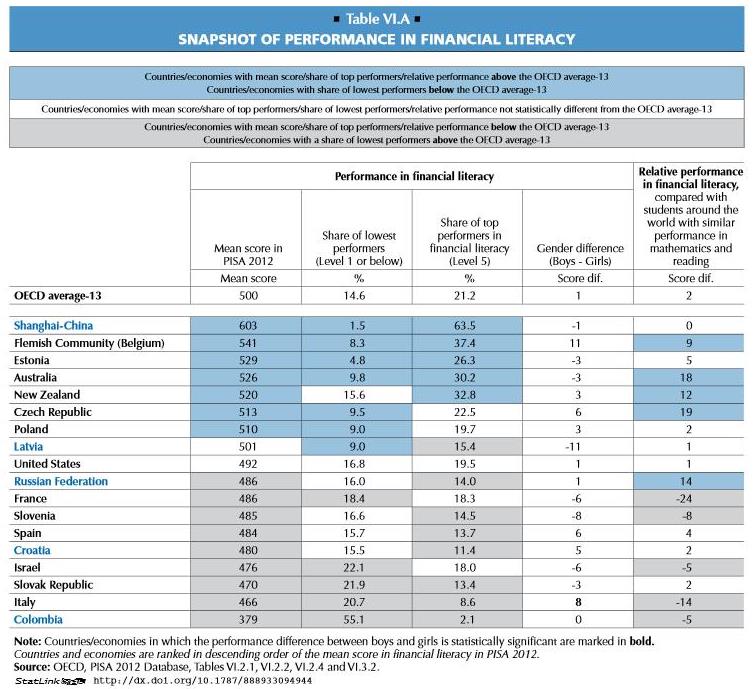
The table below provides a summary of mean scores by country. The list is ranked from top to bottom with Shanghai-China scoring the highest with an average score of 603. The U.S. comes in 9th at 492, and Colombia sits at 18th with an average score of 379. The OECD average is 500.
The color coding signals areas where there is a significant difference between the OECD average score and the country’s average score or share. Blue cells indicated above average, grey indicates below average, and no color indicates the score of share is basically equal to the OECD average.
The table provides several other interesting pieces of information. Column 2 displays the percentage of students at Level 1, the lowest level of proficiency; column 3 displays the percentage of students at Level 5, the highest level of proficiency. Column 5 looks at differences in scores between boys and girls and it’s of interest to note that on average, only Italy has a statistically significant gender difference in scores. The final column in the table looks at relative performance in financial literacy in comparison with similar scores in the mathematics and reading domains of the PISA assessment.
Snapshot of performance in financial literacy (via)
 In future posts, we’ll take a closer look at policy recommendations and financial literacy training that are also included in the 2012 PISA report.
While there seems to be consensus that financial literacy is important, there is no time for it to be taught (at least in California). It is not a part of any subject’s standards or curriculum at the state level. In my district, teaching personal finance topics frequently means sacrificing the state-approved topics which puts teachers in treacherous territory.